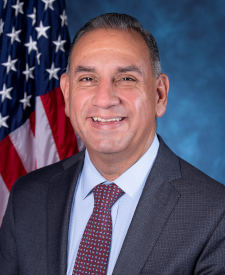
Gilbert Ray Cisneros, Jr. stock trades
Democrat · Representative for California's 31st District
In Congress since 2019
Gilbert Ray Cisneros, Jr. has disclosed 1,634 trades since 2025, most recently on Oct 12, 2026. Cisneros's most-traded stocks are DASH, BSX and GDDY. 55 trades were in an industry overseen by a committee Cisneros sits on. 71 were reported after the 45-day deadline. Over the past year, a portfolio of Cisneros's disclosed stock trades returned an estimated +7.8%, against +11.5% for the S&P 500.
- Trades disclosed
- 1,634
- Buys / sells
- 969 / 659
- Reported value
- $16.6M–$58.2M
- Committee overlaps
- 55
- Stocks traded
- 483
- Late filings
- 71
- First trade
- Jan 7, 2025
- Last disclosed
- Oct 12, 2026
Estimated returns
How a portfolio built from Cisneros's disclosed stock trades would have performed, next to the S&P 500.
Show as a table
| Date | Cisneros (est.) | S&P 500 |
|---|---|---|
| Oct 31, 2025 | +0.0% | +0.0% |
| Nov 7, 2025 | −1.3% | −1.6% |
| Nov 14, 2025 | −1.3% | −1.5% |
| Nov 21, 2025 | −5.4% | −3.4% |
| Dec 1, 2025 | −2.0% | −0.3% |
| Dec 8, 2025 | −0.8% | +0.2% |
| Dec 15, 2025 | −1.7% | −0.2% |
| Dec 22, 2025 | −0.5% | +0.7% |
| Dec 30, 2025 | −1.4% | +1.0% |
| Jan 7, 2026 | −1.1% | +1.4% |
| Jan 14, 2026 | +2.6% | +1.5% |
| Jan 22, 2026 | +3.4% | +1.3% |
| Jan 29, 2026 | +2.0% | +2.1% |
| Feb 5, 2026 | −1.6% | −0.4% |
| Feb 12, 2026 | +1.0% | +0.2% |
| Feb 20, 2026 | +2.9% | +1.4% |
| Feb 27, 2026 | +3.3% | +0.9% |
| Mar 6, 2026 | −1.0% | −1.1% |
| Mar 13, 2026 | −3.1% | −2.6% |
| Mar 20, 2026 | −5.1% | −4.4% |
| Mar 27, 2026 | −5.4% | −6.5% |
| Apr 6, 2026 | −2.3% | −2.8% |
| Apr 13, 2026 | +0.6% | +1.2% |
| Apr 20, 2026 | +3.3% | +4.5% |
| Apr 27, 2026 | +3.0% | +5.5% |
| May 4, 2026 | +3.5% | +5.9% |
| May 11, 2026 | +4.1% | +9.0% |
| May 18, 2026 | +3.8% | +8.9% |
| May 26, 2026 | +6.3% | +10.7% |
| Jun 2, 2026 | +6.6% | +12.0% |
| Jun 9, 2026 | +4.6% | +8.7% |
| Jun 16, 2026 | +6.4% | +10.6% |
| Jun 24, 2026 | +5.5% | +8.4% |
| Jul 1, 2026 | +8.9% | +10.2% |
| Jul 9, 2026 | +10.3% | +11.1% |
| Jul 16, 2026 | +9.0% | +11.0% |
| Jul 23, 2026 | +7.9% | +9.1% |
| Jul 30, 2026 | +8.9% | +9.6% |
| Aug 6, 2026 | +12.3% | +13.6% |
| Aug 13, 2026 | +13.8% | +15.0% |
| Aug 20, 2026 | +12.8% | +12.7% |
| Aug 27, 2026 | +13.4% | +14.0% |
| Sep 3, 2026 | +11.8% | +14.3% |
| Sep 11, 2026 | +10.0% | +13.0% |
| Sep 18, 2026 | +9.1% | +12.9% |
| Sep 25, 2026 | +9.0% | +14.3% |
| Oct 2, 2026 | +8.7% | +14.1% |
| Oct 9, 2026 | +9.1% | +15.4% |
| Oct 16, 2026 | +6.7% | +13.1% |
| Oct 23, 2026 | +7.5% | +12.6% |
| Oct 30, 2026 | +8.3% | +12.0% |
| Nov 2, 2026 | +7.8% | +11.5% |
Each disclosed stock purchase buys the midpoint of its reported range at that day's close, and sales sell it; returns are time-weighted and include dividends. Members report ranges rather than exact amounts and can file up to 45 days after a trade, so this is an estimate, not Cisneros's actual return. Based on 269 holdings as of Nov 2, 2026.
Committees
Trades in industries these committees oversee are flagged as committee overlaps.
- Armed Services
- Small Business
Committee overlaps
Trades in an industry overseen by a committee Cisneros sits on. An overlap is a fact about the trade, not evidence of wrongdoing.
- Armed Services CommitteeBought Moog MOG-A$1K–$15K · traded Sep 17, 2026 · 1 more trade
- Armed Services CommitteeSold Ducommun DCO$1K–$15K · traded Aug 7, 2026 · 2 more trades
- Armed Services CommitteeSold (full) AeroVironment AVAV$1K–$15K · traded Jul 2, 2026 · 3 more trades
- Armed Services CommitteeBought Cadre Holdings CDRE$1K–$15K · traded Jun 30, 2026 · 1 more trade
- Armed Services CommitteeBought Space Exploration Technologies SPCX$1K–$15K · traded Jun 18, 2026
- Armed Services CommitteeBought StandardAero SARO$1K–$15K · traded May 11, 2026 · 2 more trades
Most-traded stocks
All trades
- Oct 12, 2026$15K–$50K
Bought Benchmark Electronics BHE
$15K–$50K · Traded Oct 1, 2026 · disclosed Oct 12, 2026
- Oct 12, 2026$15K–$50K
Exchanged Thermon Group Holdings THR
$15K–$50K · Traded Oct 1, 2026 · disclosed Oct 12, 2026
- Oct 12, 2026$1K–$15K
Sold (partial) BridgeBio Pharma BBIO
$1K–$15K · Traded Sep 29, 2026 · disclosed Oct 12, 2026
- Oct 12, 2026$1K–$15K
$1K–$15K · Traded Sep 29, 2026 · disclosed Oct 12, 2026
- Oct 12, 2026$1K–$15K
$1K–$15K · Traded Sep 29, 2026 · disclosed Oct 12, 2026
- Oct 12, 2026$1K–$15K
Bought Ultragenyx Pharmaceutical RARE
$1K–$15K · Traded Sep 29, 2026 · disclosed Oct 12, 2026
- Oct 12, 2026$1K–$15K
Bought Tandem Diabetes Care TNDM
$1K–$15K · Traded Sep 29, 2026 · disclosed Oct 12, 2026
- Oct 12, 2026$1K–$15K
$1K–$15K · Traded Sep 29, 2026 · disclosed Oct 12, 2026
- Oct 12, 2026$1K–$15K
Bought Allegro MicroSystems ALGM
$1K–$15K · Traded Sep 29, 2026 · disclosed Oct 12, 2026
- Oct 12, 2026$1K–$15K
Bought Praxis Precision Medicines PRAX
$1K–$15K · Traded Sep 29, 2026 · disclosed Oct 12, 2026
- Oct 12, 2026$1K–$15K
Sold (full) Oxford Industries OXM
$1K–$15K · Traded Sep 29, 2026 · disclosed Oct 12, 2026
- Oct 12, 2026$15K–$50K
Sold (full) MACOM Technology Solutions Holdings MTSI
$15K–$50K · Traded Sep 29, 2026 · disclosed Oct 12, 2026
- Oct 12, 2026$1K–$15K
$1K–$15K · Traded Sep 29, 2026 · disclosed Oct 12, 2026
- Oct 12, 2026$15K–$50K
$15K–$50K · Traded Sep 29, 2026 · disclosed Oct 12, 2026
- Oct 12, 2026$250K–$500K
Bought Indiana Finance Authority Health System Rev Bonds
$250K–$500K · Traded Sep 29, 2026 · disclosed Oct 12, 2026
- Oct 12, 2026$100K–$250K
Sold (full) Imperial, CA, Irrigation District Bonds
$100K–$250K · Traded Sep 29, 2026 · disclosed Oct 12, 2026
- Oct 12, 2026$1K–$15K
Sold (partial) Halozyme Therapeutics HALO
$1K–$15K · Traded Sep 29, 2026 · disclosed Oct 12, 2026
- Oct 12, 2026$1K–$15K
Bought Gates Industrial Corporation GTES
$1K–$15K · Traded Sep 29, 2026 · disclosed Oct 12, 2026
- Oct 12, 2026$1K–$15K
Bought Advanced Energy Industries AEIS
$1K–$15K · Traded Sep 29, 2026 · disclosed Oct 12, 2026
- Oct 12, 2026$1K–$15K
$1K–$15K · Traded Sep 29, 2026 · disclosed Oct 12, 2026
- Oct 12, 2026$15K–$50K
$15K–$50K · Traded Sep 28, 2026 · disclosed Oct 12, 2026
- Oct 12, 2026$250K–$500K
Bought California Community Choice Financing Authority Rev Bonds
$250K–$500K · Traded Sep 24, 2026 · disclosed Oct 12, 2026
- Oct 12, 2026$1K–$15K
Bought Taiwan Semiconductor Manufacturing Company Limited TSM
$1K–$15K · Traded Sep 22, 2026 · disclosed Oct 12, 2026
- Oct 12, 2026$250K–$500K
Sold (partial) California Community Choice Financing Authority Rev Bonds
$250K–$500K · Traded Sep 22, 2026 · disclosed Oct 12, 2026
- Oct 12, 2026$1K–$15K
Sold (partial) MACOM Technology Solutions Holdings MTSI
$1K–$15K · Traded Sep 21, 2026 · disclosed Oct 12, 2026
- Oct 12, 2026$15K–$50K
$15K–$50K · Traded Sep 21, 2026 · disclosed Oct 12, 2026
- Oct 12, 2026$1K–$15K
$1K–$15K · Traded Sep 21, 2026 · disclosed Oct 12, 2026
- Oct 12, 2026$1K–$15K
Bought Enerpac Tool Group EPAC
$1K–$15K · Traded Sep 21, 2026 · disclosed Oct 12, 2026
- Oct 12, 2026$100K–$250K
Sold (full) El Camino CA Community College District GO Bonds
$100K–$250K · Traded Sep 21, 2026 · disclosed Oct 12, 2026
- Oct 12, 2026$1K–$15K
$1K–$15K · Traded Sep 18, 2026 · disclosed Oct 12, 2026
- Oct 12, 2026$1K–$15K
$1K–$15K · Traded Sep 18, 2026 · disclosed Oct 12, 2026
- Oct 12, 2026$1K–$15K
Sold (full) Western Digital WDC
$1K–$15K · Traded Sep 18, 2026 · disclosed Oct 12, 2026
- Oct 12, 2026$1K–$15K
Bought Verizon Communications VZ
$1K–$15K · Traded Sep 18, 2026 · disclosed Oct 12, 2026
- Oct 12, 2026$1K–$15K
$1K–$15K · Traded Sep 18, 2026 · disclosed Oct 12, 2026
- Oct 12, 2026$1K–$15K
Sold (partial) The Trade Desk TTD
$1K–$15K · Traded Sep 18, 2026 · disclosed Oct 12, 2026
- Oct 12, 2026$1K–$15K
$1K–$15K · Traded Sep 18, 2026 · disclosed Oct 12, 2026
- Oct 12, 2026$1K–$15K
$1K–$15K · Traded Sep 18, 2026 · disclosed Oct 12, 2026
- Oct 12, 2026$1K–$15K
Sold (full) Fidelity National Information Services FIS
$1K–$15K · Traded Sep 18, 2026 · disclosed Oct 12, 2026
- Oct 12, 2026$1K–$15K
Sold (full) Domino's Pizza DPZ
$1K–$15K · Traded Sep 18, 2026 · disclosed Oct 12, 2026
- Oct 12, 2026$1K–$15K
Sold (full) Deckers Outdoor DECK
$1K–$15K · Traded Sep 18, 2026 · disclosed Oct 12, 2026
- Oct 12, 2026$1K–$15K
Bought Cincinnati Financial CINF
$1K–$15K · Traded Sep 18, 2026 · disclosed Oct 12, 2026
- Oct 12, 2026$1K–$15K
Bought Abbott Laboratories ABT
$1K–$15K · Traded Sep 18, 2026 · disclosed Oct 12, 2026
- Oct 12, 2026$1K–$15K
$1K–$15K · Traded Sep 17, 2026 · disclosed Oct 12, 2026
- Oct 12, 2026$1K–$15K
Bought The Vita Coco Company COCO
$1K–$15K · Traded Sep 17, 2026 · disclosed Oct 12, 2026
- Oct 12, 2026$1K–$15K
$1K–$15K · Traded Sep 17, 2026 · disclosed Oct 12, 2026
- Oct 12, 2026$1K–$15K
$1K–$15K · Traded Sep 17, 2026 · disclosed Oct 12, 2026
- Oct 12, 2026$1K–$15K
Bought NXP Semiconductors NXPI
$1K–$15K · Traded Sep 17, 2026 · disclosed Oct 12, 2026
- Oct 12, 2026$1K–$15K
$1K–$15K · Traded Sep 17, 2026 · disclosed Oct 12, 2026
Committee overlap: Armed Services - Oct 12, 2026$1K–$15K
$1K–$15K · Traded Sep 17, 2026 · disclosed Oct 12, 2026
- Oct 12, 2026$1K–$15K
Sold (partial) Microchip Technology MCHP
$1K–$15K · Traded Sep 16, 2026 · disclosed Oct 12, 2026
From periodic transaction reports Cisneros filed under the STOCK Act. Amounts are the ranges members report, and trades can be disclosed up to 45 days after they happen. Nothing here is investment advice.